
Autoscaling using CloudAMQP metrics
This type of autoscaling is only available as an option if your CloudAMQP queue is on a dedicated (Bunny tier or higher) plan - in the lesser plans, we do not have the ability to extract the relevant metrics.
In order to configure the integration, your team needs to have a team or monitoring project with a service account key. If you have no permissions to create that or have no team project for such purposes, you should contact your team lead or area tech lead.
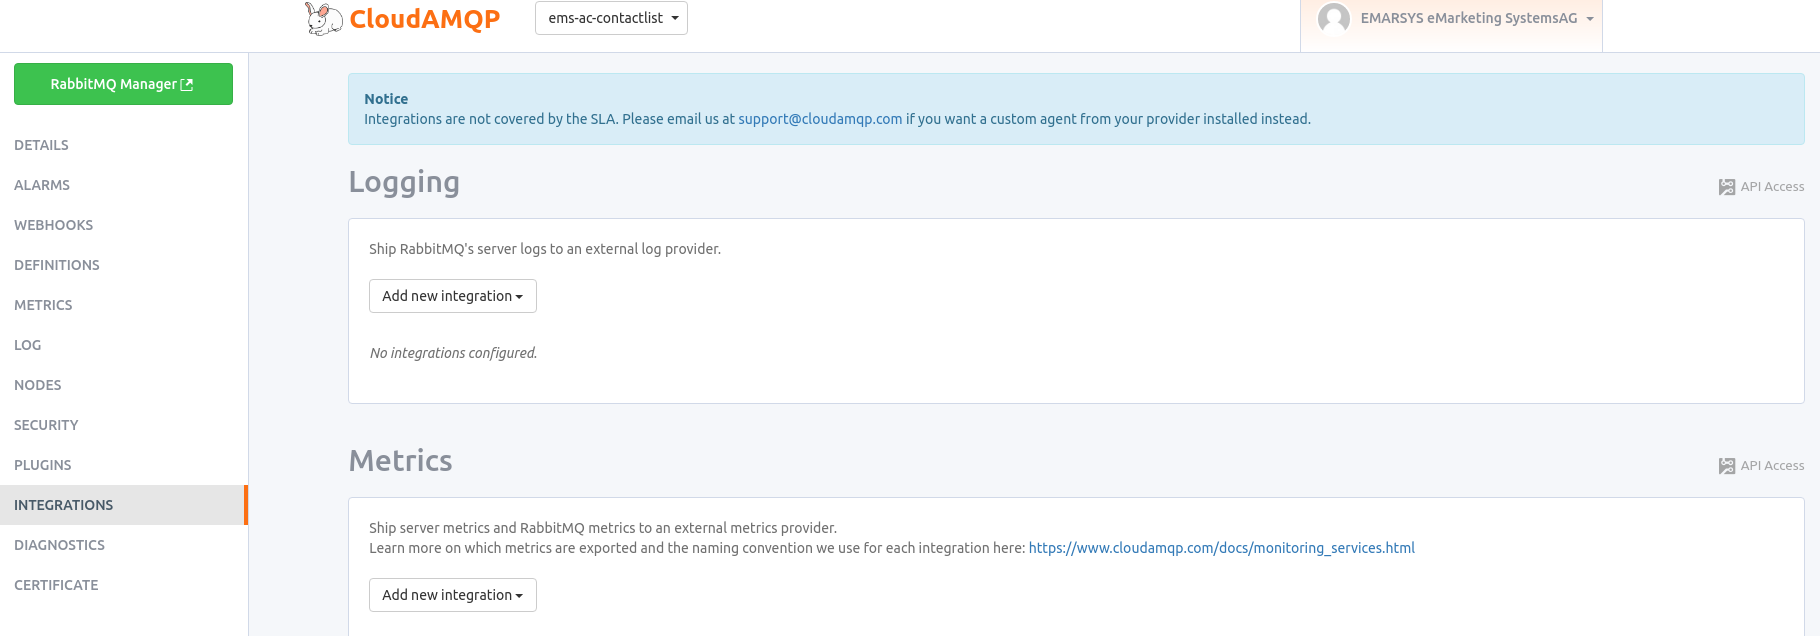
Navigate to the integration settings of the CloudAMQP instance as shown above. If your instance has an incorrect tier, the configuration options will be disabled and you will be shown a message to upgrade.
Take note of the hostname of your CloudAMQP instance (for example, devoted-hyena.rmq.cloudamqp.com) and the names of the relevant queues on the instance. You will need these details later.
Under the metrics section, click Add new integration, then select Stackdriver. You will be prompted to upload a credentials file - upload the service account key that you downloaded from the cloud console or your team’s secret portal and then click Save.
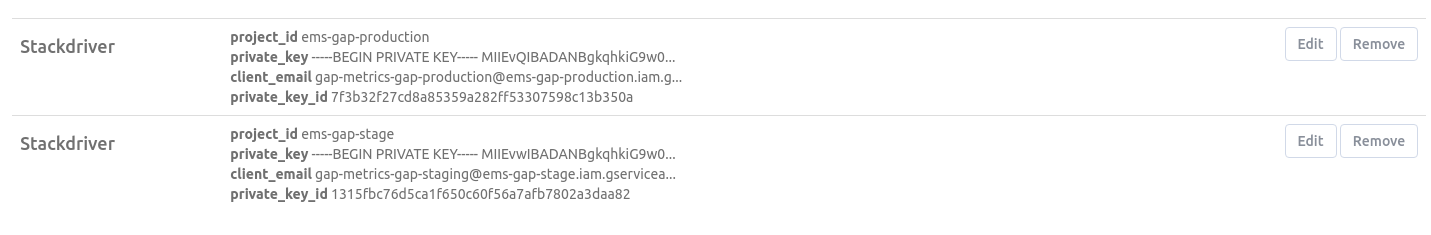
If done correctly, you should see the integrations appear in the list under metrics. The RabbitMQ instance is now configured to ship metrics directly to the correct Stackdriver. Currently, when first configured, it takes CloudAMQP 2-3 hours to begin shipping metrics to Stackdriver from your instance. Warning: there have been cases where cloudamqp broke the metrics integration it is worth to set
Navigate to the google cloud console and select your project.

Search for Monitoring once you have selected the appropriate project and select it.
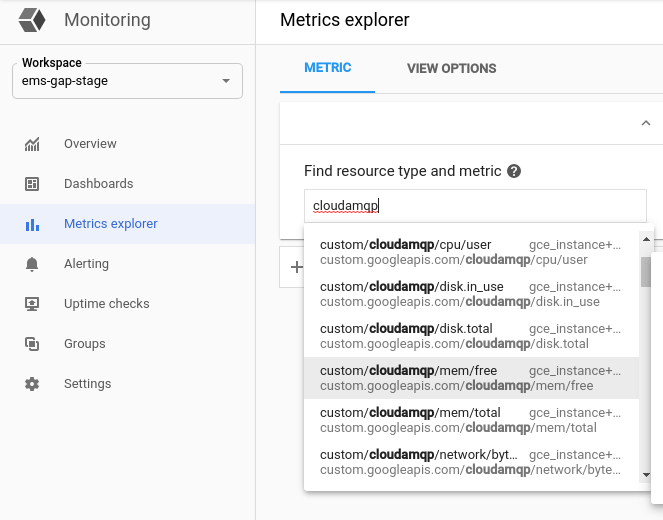
Click metrics explorer on the left and then search for cloudamqp. This will list every metric submitted by CloudAMQP. This is a good point to talk about what metrics we receive. A full list of CloudAMQP metrics is available in their documentation.
Everything available under custom/cloudamqp that is not under custom/cloudamqp/rabbitmq is instance metrics. These metrics show the resource usage on the RabbitMQ’s node and are overall not very useful for autoscaling, however, if they are showing a sustained high resource usage, an instance upgrade may be recommended.
The custom/cloudamqp/rabbitmq/overview path hosts metrics aggregated from all queues on the instance. If you use several queues and would like to scale your deployment based on their overall status rather than the status of one individual queue, these are the metrics that can be useful. If this path is taken, the filtered labels will be host.
The custom/cloudamqp/rabbitmq/queue path hosts metrics that describe individual queues on the instance. If your goal is to scale according to the state of a single queue, these are the metrics that are useful to you. The filtered labels for this option are host and rabbitmq_queue.
Try it - search for custom/cloudamqp/rabbitmq/queue/messages and check out how many messages were in the already integrated queues in the past few hours.
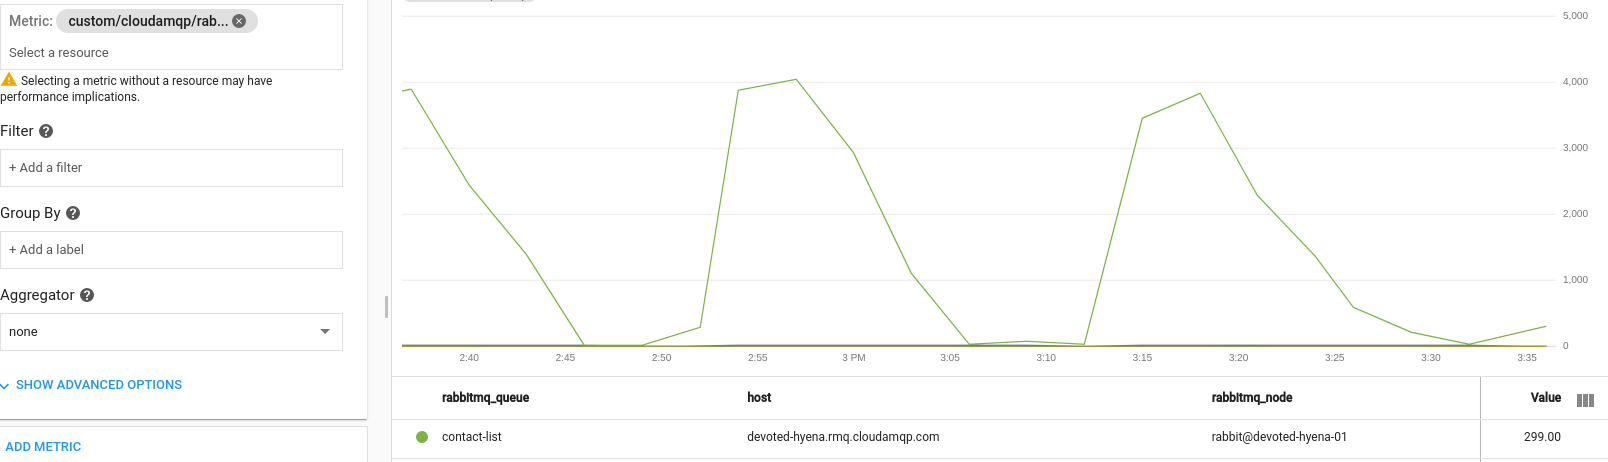
You can see that in the above image, there is a queue named contact-list on the host devoted-hyena.rmq.cloudamqp.com that periodically churns through a lot of messages.
Before you can deploy your HorizontalPodAutoscaler you need to add permission to the kubernetes service accounts that are used to query the metrics to access your project. For this you need to add
Monitoring Viewerpermission to the accounts:
- for staging hpa:
gap-metrics-gap-staging@ems-gap-stage.iam.gserviceaccount.com- for production hpa:
gap-metrics-gap-production@ems-gap-production.iam.gserviceaccount.com
In your gap.yaml set your autoscaling settings for your deployment like the example below.
If your staging and production projects, replica counts or targetValues differ use the environment specific override yaml files.
See more info here
deployments:
  test-worker:
    autoscaling:
      enabled: true
      minReplicas: 1
      maxReplicas: 10
      metrics:
      - type: External
        name: custom.googleapis.com|cloudamqp|rabbitmq|queue|messages
        selector:
          matchLabels:
            metric.labels.rabbitmq_queue: [rabbitmq-queue-name]
            metric.labels.host: [rabbitmq-instance-host]
            resource.labels.project_id: [your-monitoring-project]
        targetValue: "5"
Substitute the appropriate fields in the above YAML to get started.
The name field is the path provided by Stackdriver, substituting custom with custom.googleapis.com and replacing every instance of slash (/) with a pipe(|). Therefore, the name for the metric path custom/cloudamqp/rabbitmq/queue/messages is custom.googleapis.com|cloudamqp|rabbitmq|queue|messages.
The selector field is the set of labels to match for within the path. All metric labels are keys within the matchLabels field, prefixed with metric.labels., so the metric label named host is referred to with the key metric.labels.host. For a metric to be admissible, all labels on the metric must match the values provided here, but not filtering for all the labels that uniquely identify the source may cause unexpected behaviour, such as the aggregation of metrics from all hosts.
If you opted above to use the approach to monitor all queues rather than a single one, make sure you replace the name field with the appropriate /overview/ path and remove the rabbitmq_queue label filter.
In the version of Kubernetes that is currently running on the cluster, we do not have any more granular control over how the autoscaling happens, in all cases the default behaviour is used. The default behaviour of the autoscaler is to rotate is to double the number of pods every 60 seconds whenever the target value is exceeded. If the number of pods rotating in is less than 4, 4 additional pods are added instead. In all cases, this cannot scale beyond the maximum number of replicas specified. Similarly, when downscaling is required, the amount of pods is halved every 60 seconds.
You may notice that this autoscaling tends to overscale your deployments. This is expected behaviour as our external metrics are not real-time - CloudAMQP will aggregate and post metrics no more often than once a minute, unlike internal operational metrics which are available in real-time to Kubernetes. There is no reason to worry about this, just note that for the time being, Kubernetes may have a disproportionately large response to traffic spikes that we would not classify as severe. In a future version, this behaviour will be more controllable.
If you do not have k9s installed, check out this tutorial on how to install and use it.
Open k9s, navigate to the appropriate kubernetes context (staging or production) and type :hpa, then press enter. You will be taken to the list of horizontal pod autoscalers in the cluster.

Here, you can see the overview of your autoscaler - which deployment it scales, the current and target value of the metric that you are scaling on, what the minimum and maximum number of pods are that the autoscaler will scale to, and the current number of replicas.
By hitting Enter while the appropriate HPA is selected, you can view even more details about the actions taken by the scaler.
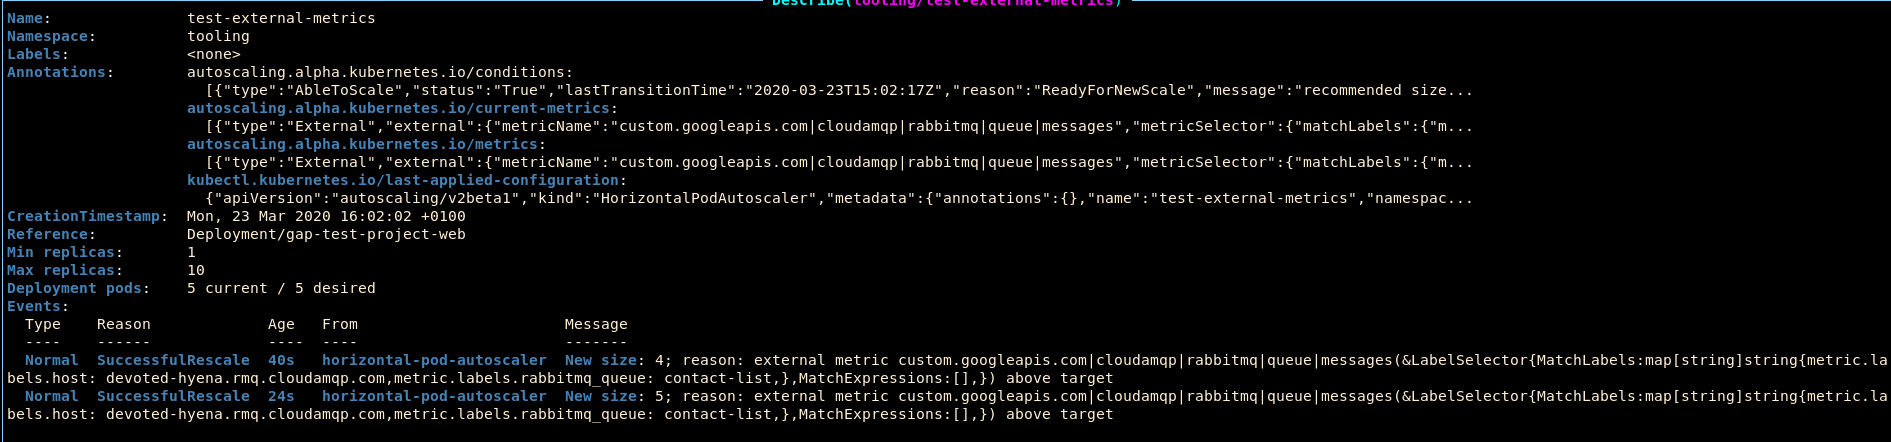
This image shows the details of the example autoscaler used for this tutorial. The events section in the description describes the aggregated actions taken by this autoscaler. While this information can get messy over time, you can track what actions were taken recently by looking at the age of the event. In this image, it is shown that 40 seconds ago, the autoscaler decided to increase the number of pods in the deployment to 4, and then 16 seconds later, it decided to further increase the number of pods to 5 in response to a value that is still over target.